Fig. 2.

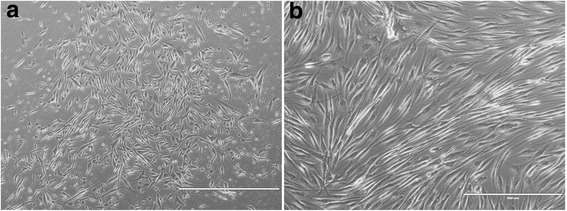
Low-resolution phase contrast of primary cultured human skeletal muscle cells and mature myotubes. a, b Phase contrast imaging of muscle cells; scale bar in (a) represents 1000 μm and 400 μm in (b)

Low-resolution phase contrast of primary cultured human skeletal muscle cells and mature myotubes. a, b Phase contrast imaging of muscle cells; scale bar in (a) represents 1000 μm and 400 μm in (b)