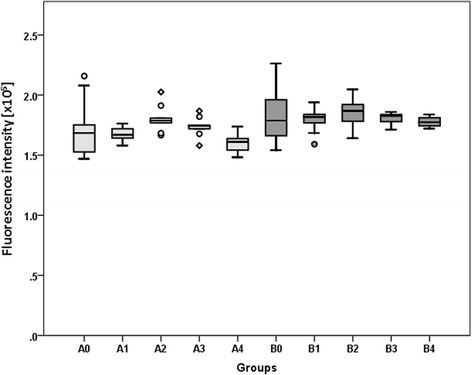
Fig. 4.

Results of alamarBlue® Assay to determine cell viability. The panels show Tukey boxplots of absolute values of the emission at 570 nm of the alamarBlue® assay performed for cells in groups A0 to A4 (light gray bars) and groups B0 to B4 (dark gray bars) after exposure to radial extracorporeal shock waves (groups A1–A4 and B1–B4) or sham-exposure (groups A0 and B0) as outlined in Table 1. Results of statistical analysis are indicated (Dunnett’s test; comparison to control)
