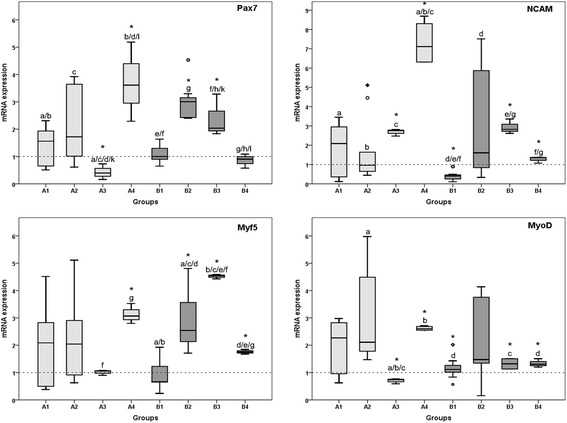
Fig. 5.

Results of qRT-PCR analysis. The panels show Tukey boxplots of 2-ΔΔCt values of mRNA expression of Pax7, NCAM, Myf5, and MyoD determined with quantitative real-time polymerase chain reaction on day 3 (groups A1 to A4; light gray bars, single exposure to rESW) or day 7 (groups B1 to B4; dark gray bars, double exposure to rESW) compared to the non-treated groups (A0 and B0, respectively). Statistical significances between the groups on day 3 and day 7 as well as between day 3 and 7 are indicated with same letters. Statistical significance to the control groups are indicated with asterisks (Mann-Whitney U test; comparison to control) with p < 0.05
