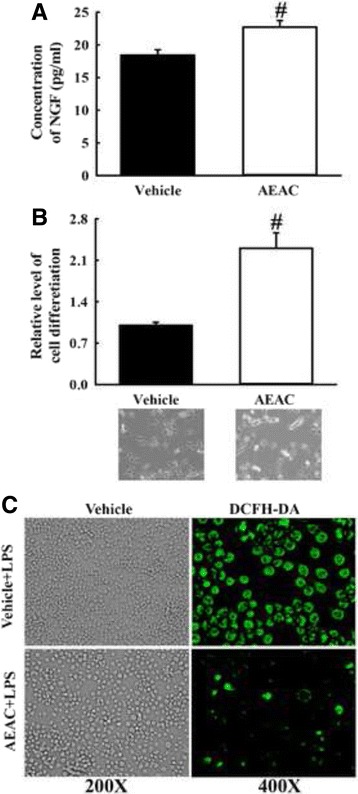
Fig. 2.

NGF stimulation capacity and anti-oxidant activity of AEAC in neuronal cells. a NGF concentration in the supernatant collected from each group was measured using an anti-NGF ELISA kit NGF. b Conditional medium (CM) was collected from B35 cells stimulated with AEAC for 24 h, then transferred to undifferentiated PC12 cells. After 24 h the cell morphology was observed at 200× using a microscope. The length of PC12 cells was measured using Leica Application Suite (Leica Microsystems). Values shown represent the means ± SD of three experiments. #, P < 0.05 compared to the Vehicle treated group. c Determination of intracellular ROS production. After DCFH-DA treatment, green fluorescence in cells of subset groups was observed using a fluorescent microscope (Eclipse TX100, Nikon, Tokyo, Japan). BV-2 cells in each square of a 200× magnification image (left column) were further examined under 400× magnification (right column)
