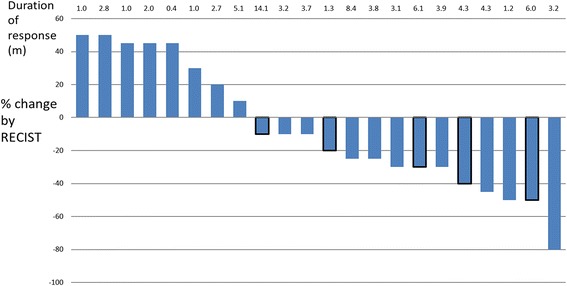
Fig. 1.

Waterfall plot of best change from baseline for 22 osteosarcoma patients. Patients’ clinical evaluations are indicated on the vertical graph as total volume increase or decrease. The numbers on the horizontal graph indicate the number of months of duration response. Strips with black frame indicate follow-up not yet at end point, and the patients’ status might continue unchanged for some while
