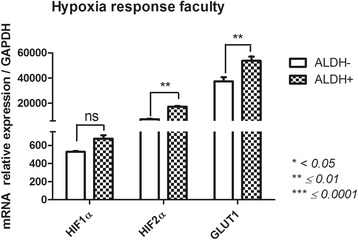
Fig. 6.

Hypoxia-related gene expression profile of FSK-MSC subsets according to ALDH activity. After flow cytometry sorting of ALDH+ and ALDH- FSK-MSC subsets, we investigated by qPCR the expression profiles of hypoxia-associated genes HIF1α, HIF2α and GLUT1. Data are presented as mean ± SEM of mRNA gene expression relative to GAPDH expression. (ns = non significant)
