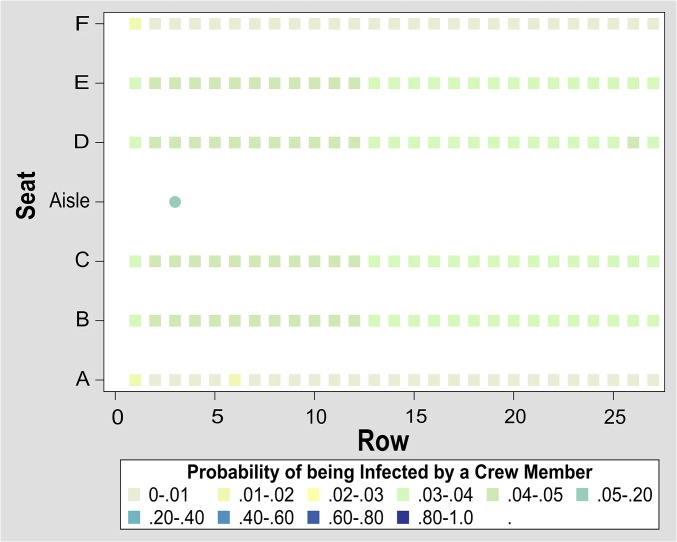
Fig. 4.
This seating heat map shows the probability of an infectious crew member infecting each of the other passengers (square) and crew members (circle) when the probability of infection is set at 0.0045 per 1 min of contact. In this example, other crew members are at highest risk, followed by passengers seated in aisle and middle seats.

