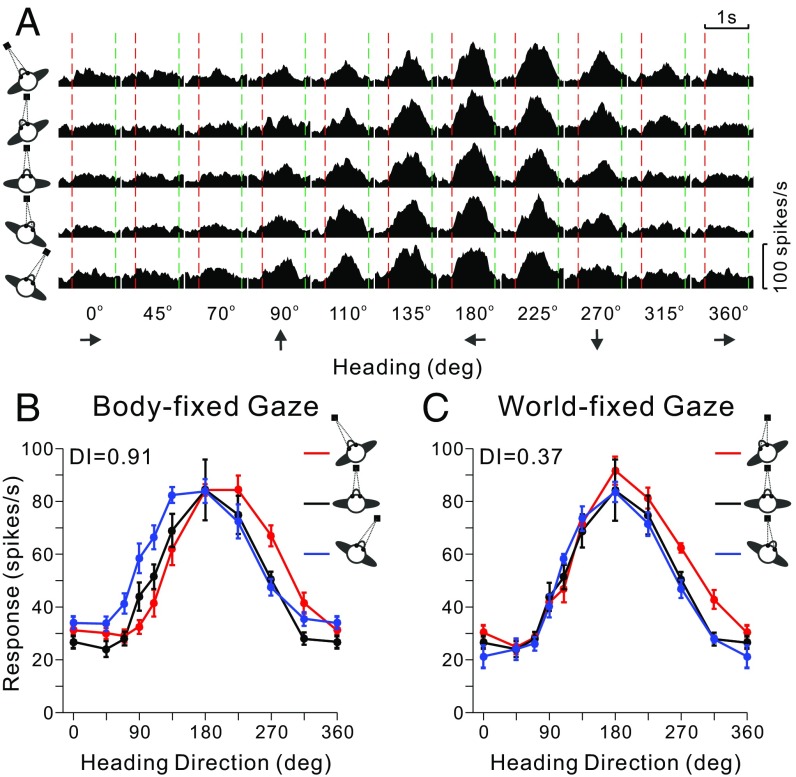
Fig. 2.
Data from an example VIP neuron. (A) Response peristimulus time histograms are shown for the 10 headings (x axis) and each of the five combinations of [body-in-world, eye-in-head] positions: [−20°, 0°], [−20°, 20°], [0°, 0°], [20°, −20°], [20°, 0°] (rows, top to bottom). The red and green vertical dashed lines represent the start and end of platform motion (which followed a straight trajectory for each different heading with a Gaussian velocity profile). (B) Tuning curves for the body-fixed gaze condition. The three tuning curves show mean firing rate (±SEM) as a function of heading for the three combinations of [body-in-world, eye-in-head] position ([−20°, 0°], [0°, 0°], [20°, 0°]) that have constant eye-in-head position, as indicated by the red, black, and blue curves, respectively. (C) Tuning curves for the world-fixed gaze condition for the three combinations of [body-in-world, eye-in-head] position ([−20°, 20°], [0°, 0°], [20°, −20°]) that involve fixation on the same world-fixed target.

