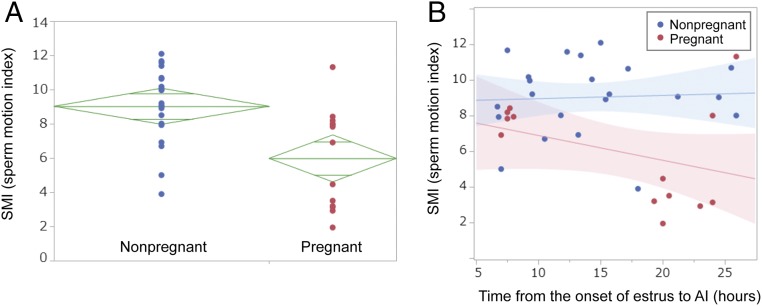
Fig. 4.
The SMI distribution of sorted spermatozoa in relation to AI outcome and the effect of SMI and AI timing to pregnancy rate. (A) Comparison of SMI distribution of sorted spermatozoa used in AI between pregnant and nonpregnant groups. Diamond mark of each group indicates the following: height, 95% confidence interval; width, sample number of each group; center horizontal line of each diamond mark, average SMI of each group. Two shorter horizontal lines of each diamond mark are overlapped marks. Overlap marks in one diamond that are closer to the mean of another diamond than that diamond’s overlap marks indicate that those two groups are not different at 95% confidence interval. Because the overlap marks in one diamond (nonpregnant) are not close to the overlap marks of the diamond of another group (pregnant), they are significantly different at 5% confidence level. (B) Correlation between SMI and timing of insemination. Red plots represent sorted spermatozoa resulting in pregnancy after insemination. Red and blue lines are regression lines, and halftone dot meshing indicates 95% confidence interval of each group. Each insemination contains ≤1 million sorted spermatozoa.

