Fig. 2.
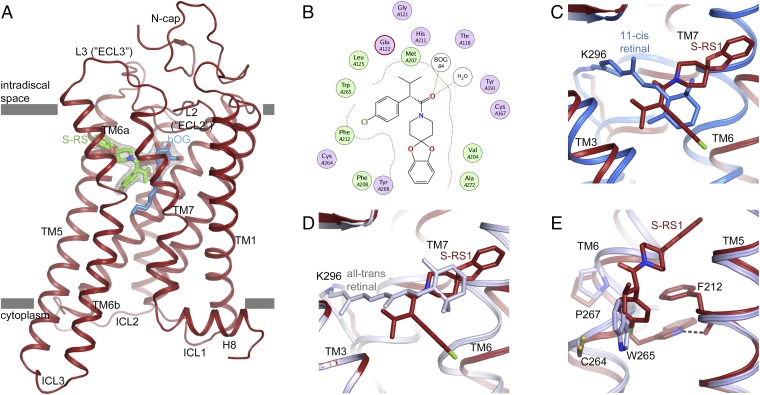
Opsin stabilization by S-RS1. (A) Side view of the S-RS1–opsin complex in cartoon representation. S-RS1 and a neighboring β-octyl glucoside shown in green and blue sticks are located at the orthosteric GPCR binding pocket. Experimental electron density (Fo-Fc) maps (gray mesh) for the ligands contoured at 3 σ. (B) MOE-calculated protein–ligand plot identifying mainly hydrophobic amino acids and two hydrogen bonds (dotted lines) that contribute to ligand binding. Hydrophilic residues are purple, blue rings indicate basic groups, red rings indicate acidic groups, and hydrophobic residues are green. (C and D) Superposition of the S-RS1–opsin complex with (C) dark-state (blue; PDB ID: 1GZM) and (D) meta-II active-state rhodopsin (blue-white; PDB ID: 3PQR) highlighting the overlap of the functional groups of the ligand with retinal’s β-ionone ring in two different conformations. (E) S-RS1–induced outward shift of Trp2656.48 within the highly conserved CWxP motif. The initial χ angle of −81° in opsin (light blue; PDB ID: 4J4Q) changes to −174° in the S-RS1 complex.

