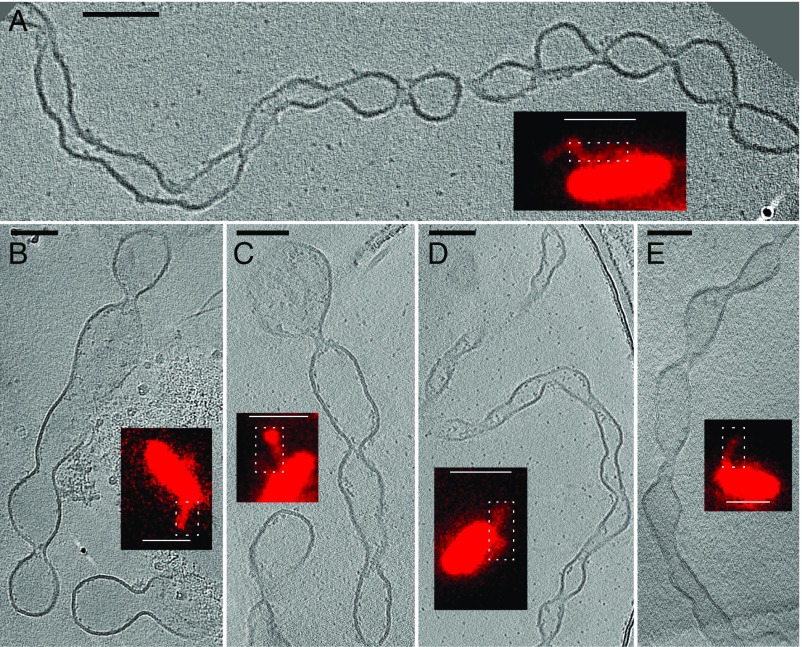
Fig. 3.
Targeting dynamic OM extensions of S. oneidensis for ECT using correlative light and electron microscopy. Target locations on fixed and plunge-frozen electron microscopy grids, from the perfusion flow imaging platform, were imaged by ECT, revealing the OMV chain morphology of the OM extensions. (A–E) Representative images from ECT, with corresponding fLM image (Insets). (ECT scale bars, 100 nm; fLM scale bars, 2 µm.) White dotted boxes in the fLM images indicate the corresponding approximate regions imaged in ECT. The ECT images shown are tomographic slices from 3D reconstructions (Fig. S6 and Movies S1 and S2).

