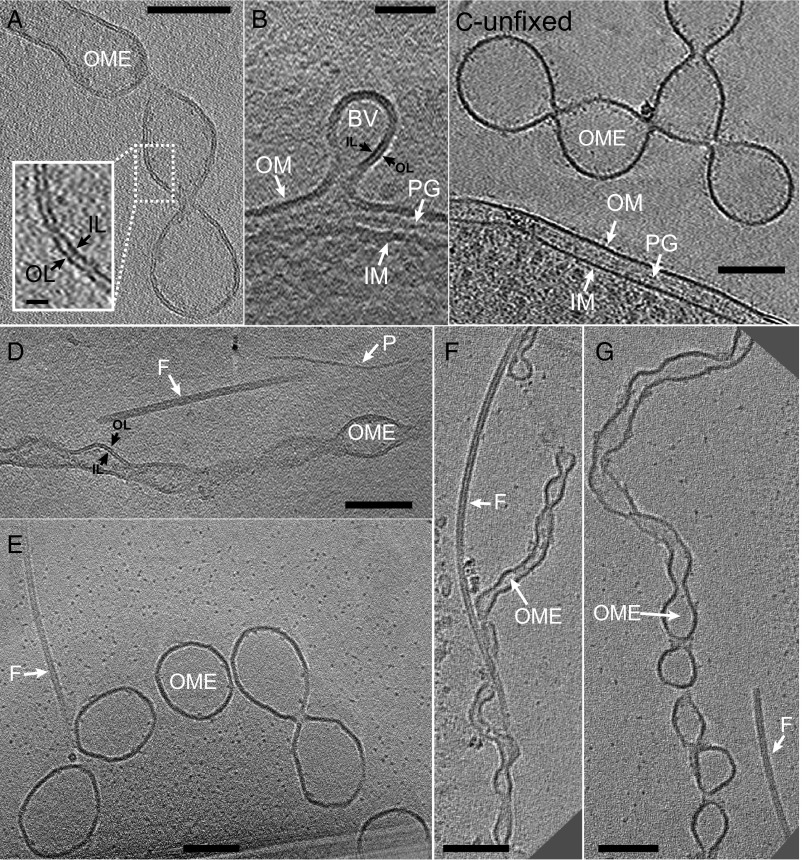
Fig. 4.
ECT images of S. oneidensis OM extensions. (A) OM extension membrane bilayer is clearly resolved. Inset is enlarged view of boxed region with the inner and outer leaflets indicated with arrows. (Scale bar, 100 nm; Inset scale bar, 10 nm.) (B) A budding vesicle emerging as an extension of the cellular outer membrane. A similar process perhaps underlies the initial stages of OM extension formation. (Scale bar: 50 nm.) (C) OM extension from an unfixed chemostat sample exhibits identically branched OMV chain morphology as observed in both unfixed and fixed samples from the perfusion flow imaging platform. (Scale bar: 100 nm.) (Figs. S5 and S9 and Movie S13.) (D) An OM extension, a flagellum, and a pilus next to each other, allowing direct comparison of their sizes and morphologies, indicating that ECT facilitates the identification and distinguishability of different extracellular appendages in S. oneidensis. (Scale bar: 100 nm.) (Movie S4.) (E–G) ECT reveals OM extensions are of varying thicknesses and degrees of tubulation. Next to each OM extension is a flagellum that can act as a molecular marker for comparison of varying OM extension dimensions. (Scale bar: 100 nm.) (Movie S5 corresponds to F.) BV, budding vesicle; F, flagellum; IL, inner leaflet; IM, inner membrane; OL, outer leaflet; OME, OM extension; P, pilus; PG, peptidoglycan.

