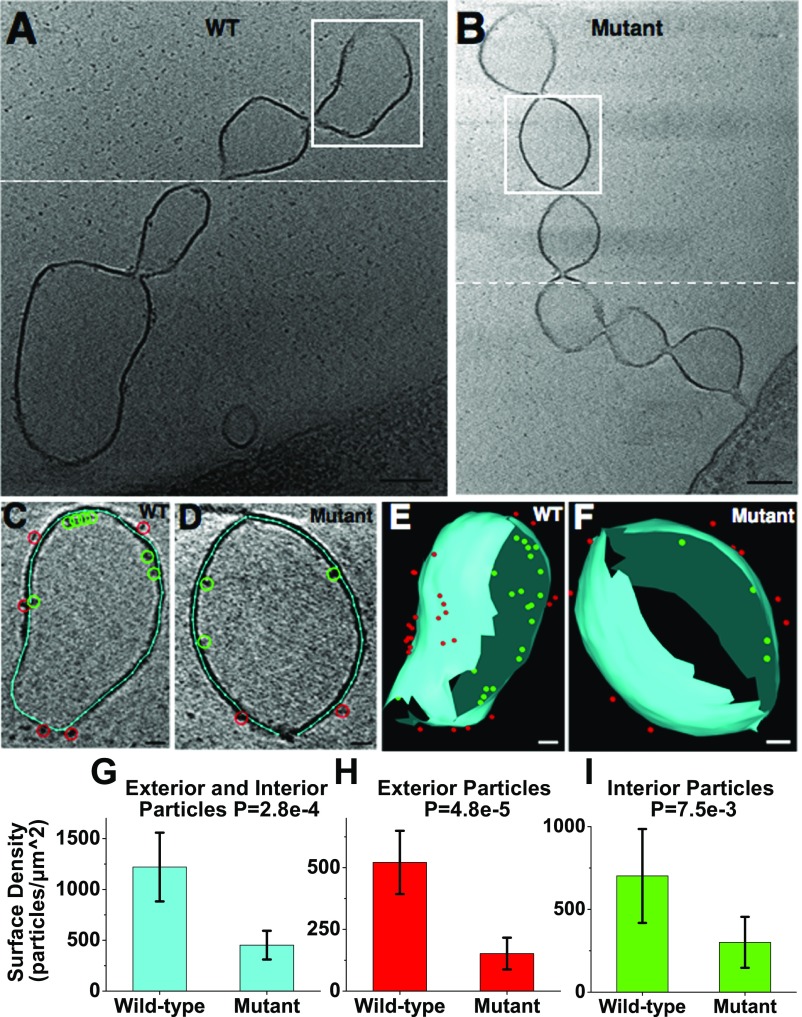
Fig. 6.
Difference in surface density along OM extensions between S. oneidensis wild type and a mutant lacking all identified functional OM and periplasmic cytochromes (∆Mtr/∆mtrB/∆mtrE) (40). (A and B) Representative ECT images of OM extensions from wild-type and mutant strains, respectively, revealing electron-dense particles on the interior and exterior of the membrane. White dashed line indicates two different slices have been combined to provide the best possible view of OM extension. (Scale bar: 100 nm.) (C and D) Enlarged views of the vesicle from the boxed regions in A and B, respectively, with membrane (cyan line), interior particles (green circles), and exterior particles (red circles) labeled as model points. (Scale bar: 20 nm.) (E and F) The 3D reconstructions of the vesicles in C and D, respectively. Meshed view of the membrane is generated and all of the observed interior and exterior densities are shown as model points in 3D. (Scale bar: 20 nm.) (Movie S11.) (G–I) Surface density (in particles/µm2) of total, exterior, and interior particles in the wild-type (n = 8) and cytochrome mutant (n = 5) OM extensions (one vesicle analyzed per OM extension). Statistical significance is determined by P values from unpaired one-tailed Student’s t tests. Error bars represent one SD around the mean.

