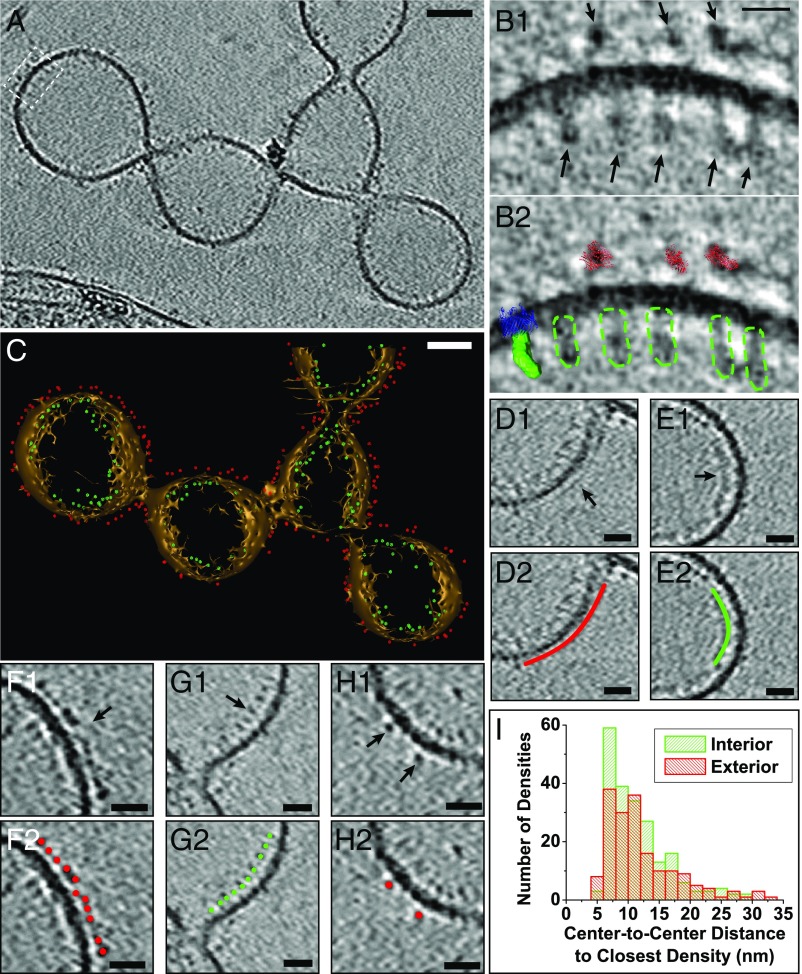
Fig. 7.
Positions and packing of decaheme cytochromes along the OM extension length in S. oneidensis. (A) ECT image of an unfixed OM extension showing densities on both the interior and exterior of the OM corresponding to putative MtrA and MtrC cytochromes, respectively. (Scale bar: 50 nm.) (B1) Enlarged view of boxed area from A. (B2) Comparison of EM densities in B1 with the crystal structure of MtrC (26), low-resolution SAXS model of MtrA (41), and the MtrB homolog LptD (72, 73) (only the LptD structure was used for this model from the LptD-LptE two-protein crystal structure), highlighting the similarity in overall shape and size of these structures to the observed EM densities. Red, MtrC crystal structure; green, surface view of MtrA SAXS model; blue, LptD crystal structure; dotted green, outline of putative MtrA densities on the EM map. (Scale bar: 10 nm.) (C) A 3D isosurface view of the OM extension in A with all of the interior and exterior densities (putative MtrA and MtrC, respectively) represented as model points in green and red, respectively. (Scale bar: 50 nm.) (Movie S12.) (D–H) Representative regions from the OM extension in A demonstrating differences in packing density of MtrA and MtrC. (D1 and E1) Continuous exterior (D1) and interior (E1) densities that may be related to tightly packed MtrC and MtrA, respectively. (F1) Relatively closely packed exterior densities of putative MtrC with an average center-to-center interdensity distance of 7.3 nm (SD = 2.1 nm). (G1) Relatively closely packed interior densities of putative MtrA with an average center-to-center interdensity distance of 8.9 nm (SD = 2.0 nm). (H1) Isolated exterior densities of putative MtrC. D2, E2, F2, G2, and H2 are duplicates of D1, E1, F1, G1, and H1, respectively, with model points or lines highlighting the interior (green) and exterior (red) densities. (Scale bars: 20 nm.) (I) Histogram showing distribution of center-to-center distances to closest densities for all observed putative MtrAs (in green) and MtrCs (in red).

