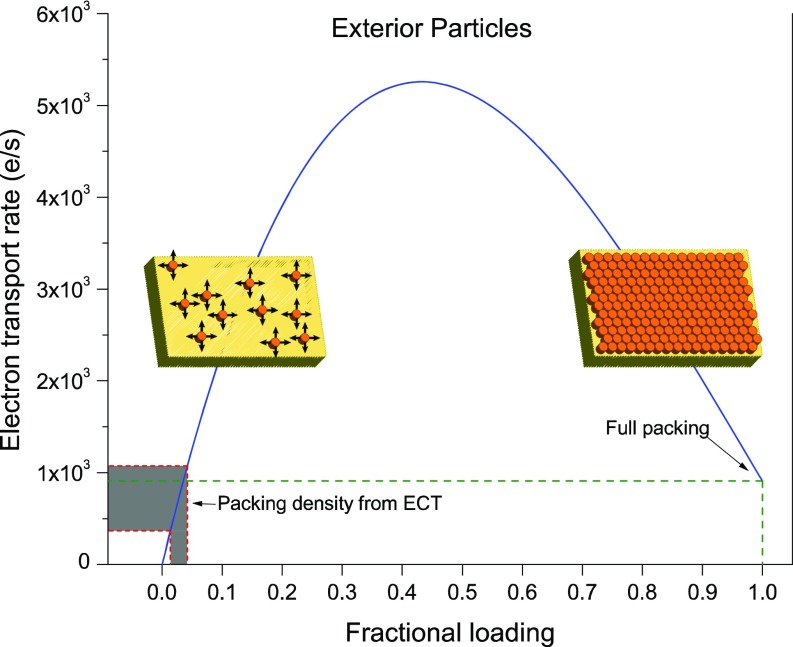
Fig. 8.
Calculated ET rates along S. oneidensis OM extensions based on the Blauch–Saveant model (42). With MtrC as the main electron carrier, and accounting for both electron hopping and cytochrome physical mobility, ET rates are plotted (blue curve) as a function of cytochrome fractional loading (ratio of measured to the maximum possible cytochrome density). The gray-shaded area shows the range of calculated ET rates for OM extensions using cytochrome densities found in ECTs (one vesicle per tomogram from nine tomograms analyzed). The model predicts transport rates at full packing cytochrome density (fractional loading = 1) comparable with rates calculated from ECT data.

