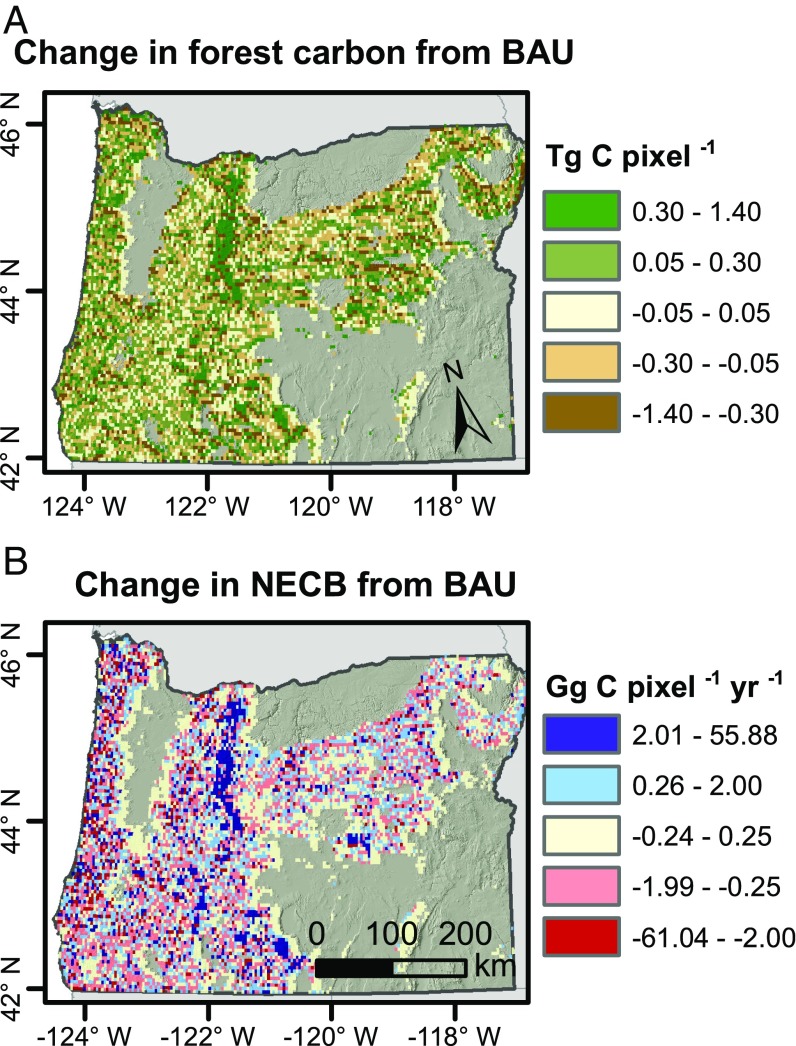
Fig. 4.
Spatial patterns of forest carbon stocks and NECB by 2091–2100. The decadal average changes in forest carbon stocks (A) and NECB (B) due to afforestation, reforestation, protected areas, and lengthened harvest cycles relative to continued BAU forest management (red is increase in NECB) are shown.

