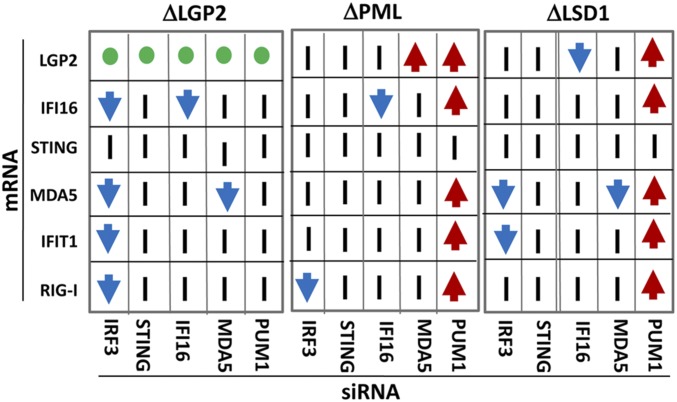
Fig. 7.
Summary of the accumulation of mRNAs in knockout cells transfected with siRNAs targeted to IRF3, STING, IFI16, MDA5, or PUM1. The three panels summarize the results of analyses ΔLGP2, ΔPML, or ΔLSD1 cell lines. For each panel, the x axis shows the transfected siRNA. The y axis identifies the mRNA. Red arrows indicate that the siRNA caused at least a fourfold increase in the mRNA level relative to that of mock-transfected cells. Blue arrows indicate that the siRNA caused at least a fourfold decrease in the mRNA relative levels in mock-transfected cells. A vertical bar indicates no significant changes. The green circle indicates that as expected, no LGP2 mRNA could be detected in ΔLGP2 cells. Last, the black circles identify mRNAs specifically targeted by corresponding mRNAs, and therefore expected to be down-regulated.

