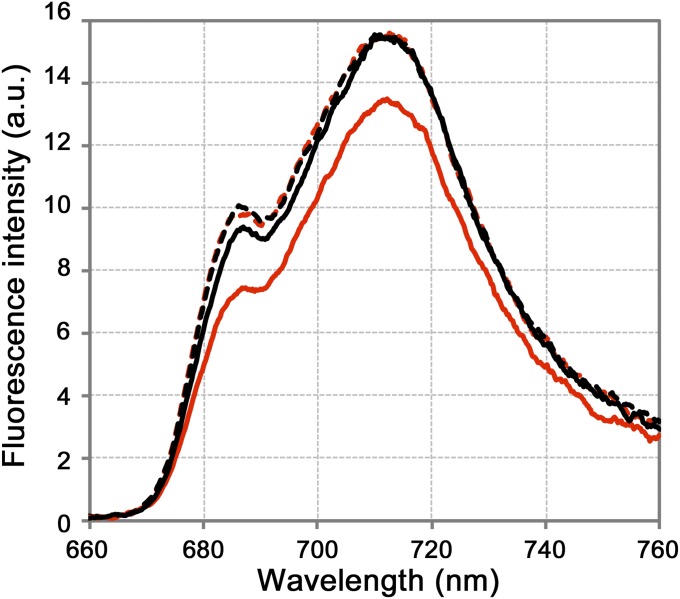
Fig. 2.
Low-temperature absolute fluorescence spectra of isolated thylakoid membranes. Fluorescence spectra of the isolated thylakoid membranes from npq4 (solid line) and npq4/lhcsr1 (dashed line). The membranes were treated with either pH 7.5 (black) or pH 5.5 (red) buffers. The fluorescence spectra were recorded with an integration sphere to obtain the absolute fluorescence photon counts for the samples. Samples normalized to 8 μg Chl/mL were excited at 480 nm.

