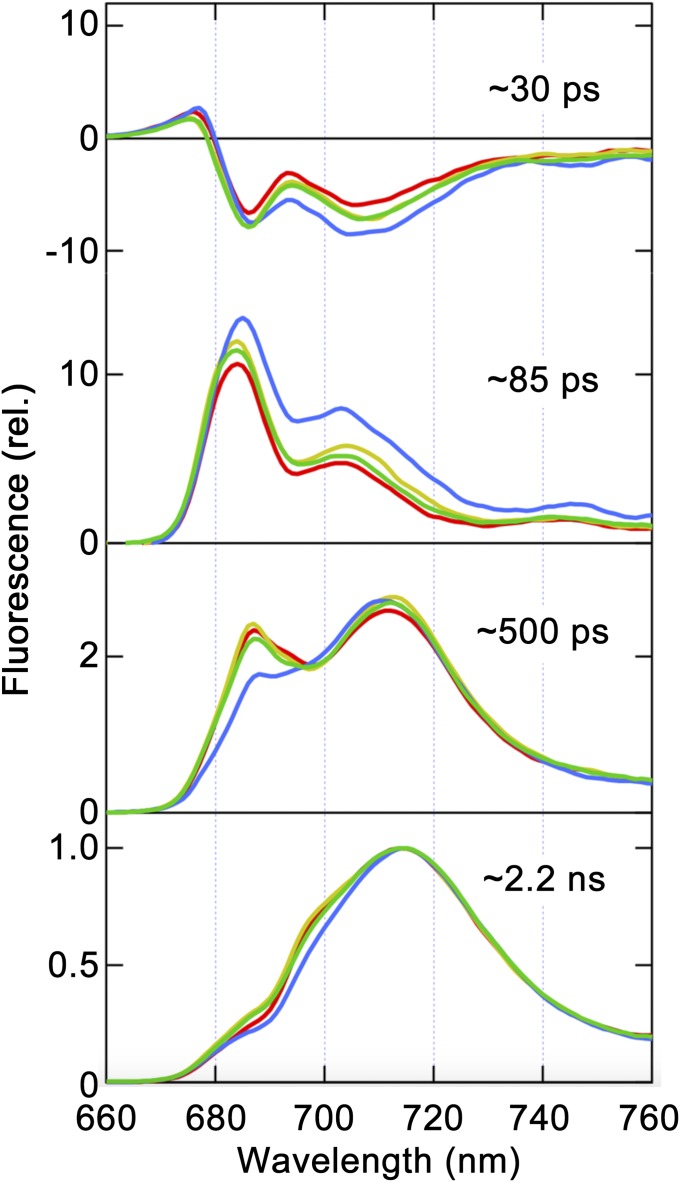
Fig. 3.
Time-resolved fluorescence decay-associated spectrum analysis of isolated thylakoid membranes at 77 K. FDAS were derived from the time-resolved fluorescence profiles of thylakoid membranes obtained via excitation at 459 nm. The colored lines represent npq4 at pH 7.5 (green) and pH 5.5 (blue) and npq4/lhcsr1 at pH 7.5 (yellow) and pH 5.5 (red). The spectra were normalized to the maximum intensity of the slowest component (∼2.2 ns).

