Fig. 1.
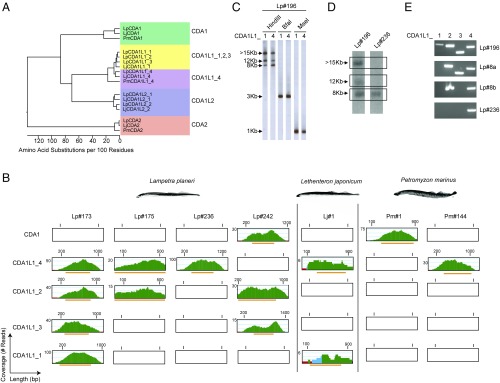
Identification and difference in copy number of CDA1-like genes in lamprey. (A) Phylogenetic tree showing relationship between lamprey CDA1, CDA1-like, and CDA2 sequences. Distance values are presented as number of amino acid changes per 100 residues calculated using the Kimura distance formula and multiplied by 100 (76). (B) Read coverage plots in whole genome sequences. Green color indicates a coverage by more than five reads; blue, two to five reads; and red, a single read. Orange bars correspond to region of the contigs containing the ORFs of the exons. (C) Representative Southern filter hybridizations of genomic DNAs of Lampetra planeri Lp#196 after digestion with the indicated restriction enzymes hybridized with the indicated probes (sequences deposited as GenBank entries, MG495254 and MG495256). (D) Southern filter hybridizations of genomic HindIII restriction digests of genomic DNAs of L. planeri individuals with different CDA1L1 gene copy numbers hybridized with CDA1L1_4 probe used in C. The autoradiographic images shown are taken from different parts of the same film. (E) PCR analysis of CDA1L1 genes from L. planeri individuals with different CDA1L1 copy numbers. The identities of PCR products were confirmed by sequencing.

