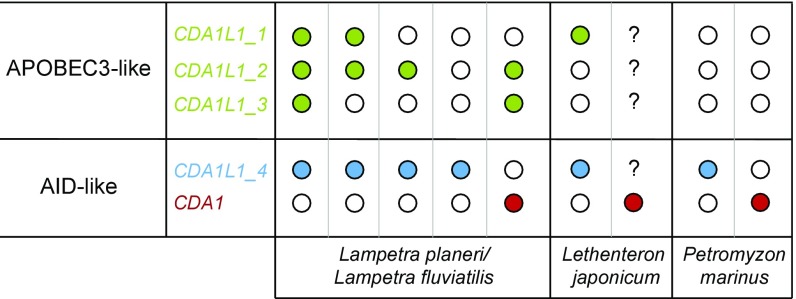
Fig. 4.
Summary of the genomic configurations of CDA1-related genes in different lamprey species analyzed in this study and schematic representation of unique CDA1 and CDA1-like genotypes in different lamprey species. Each column represents a different animal of that species. Colored dots represent confirmed presence of genes (green, CDA1L1_1, _2, or _3; blue, CDA1L1_4; and red, CDA1); open dots correspond to absent; “?” corresponds to unexplored presence of genes. For details, see SI Appendix, Table S3.

