Fig. 4.
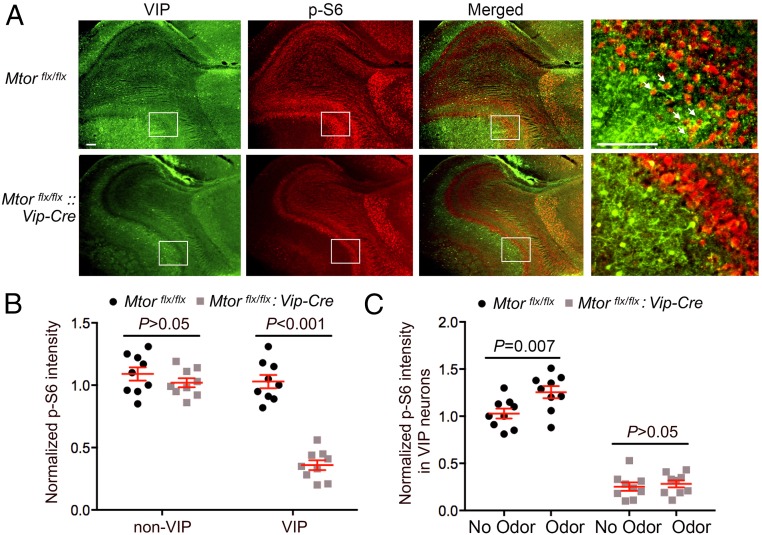
mTOR signaling in the olfactory bulb. (A) Representative fluorescent microscopic images showing immunolabeling for VIP (green) and p-S6 (red) in the mouse OB. Framed regions are magnified and shown (Right) as a merged image. White arrows indicate cells expressing both p-S6 and VIP in the external plexiform layer. (Scale bars, 100 μm.) (B) Quantitation of p-S6 labeling intensity in the OB. Note that p-S6 level was markedly decreased in the VIP-expressing layer (EPL) but not in a non-VIP layer (mitral cell layer) in Mtorflx/flx:Vip-Cre mice. (C) Quantitation of p-S6 labeling intensity in the OB. For this experiment, mice were exposed to an odorant (essence oil) for 15 min at CT15 and killed 45 min after the end of odor exposure. See Materials and Methods for detailed methods of quantitation. Note that odor evoked significant p-S6 up-regulation in the OB of Mtorflx/flx mice but not in Mtorflx/flx:Vip-Cre mice. For B and C, data are presented as individual values as well as mean ± SEM. Three mice were included in each group and three brain sections were used from each animal.

