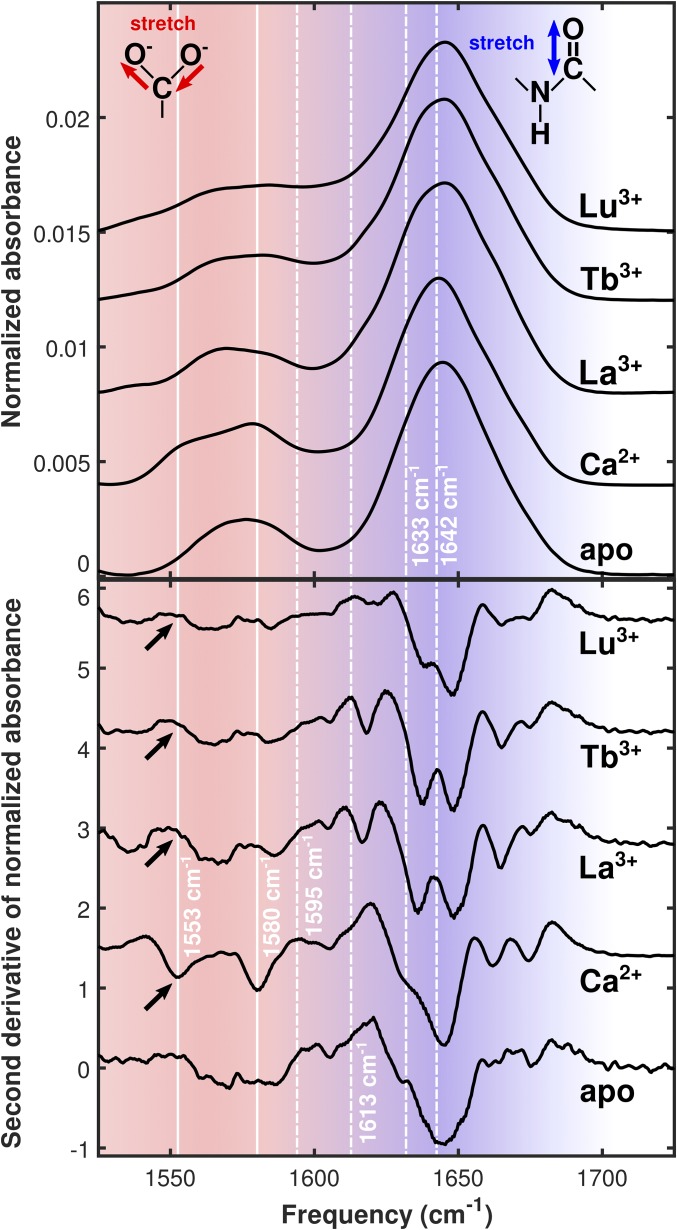
Fig. 4.
(Top) FTIR spectra of apo-CaM and CaM bound to the series of ions used in this study. (Bottom) Second derivative plots of the FTIR spectra. Solid white lines highlight peaks corresponding to different modes of carboxylate ion coordination in Ca2+−CaM. The bidentate glutamate peak is visible in the Ca2+-bound spectrum at 1,553 cm−1, while the monodentate peak is visible at 1,580 cm−1. Large, broad absorptions around 1,640 cm−1 are amide I modes in the protein backbone. Dashed white lines drawn at 1,595 cm−1, 1,613 cm−1, 1,633 cm−1, and 1,642 cm−1 highlight 2D IR cross-peak locations. Black arrows indicate the expected locations of absorption features arising from carboxylate groups in the bidentate coordination configuration.

