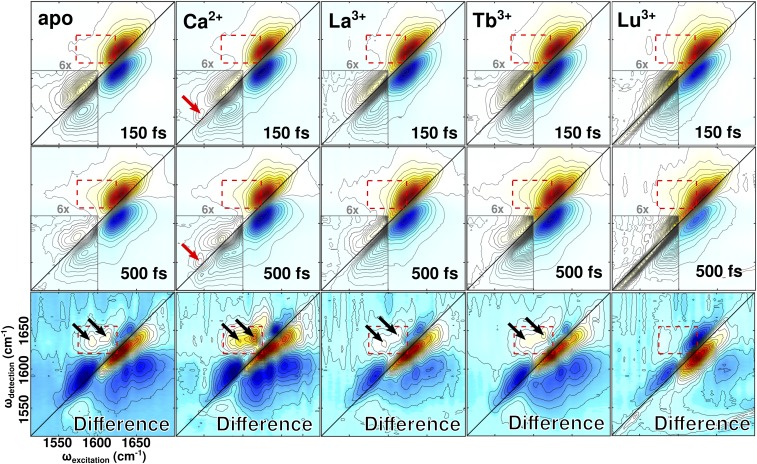
Fig. 5.
The 2D IR spectra of apo-CaM, Ca2+−CaM, and Ln3+−CaM. Spectra were collected at t2 delays of 150 fs and 500 fs. Difference spectra show the result of subtracting the 150-fs spectrum from the 500-fs spectrum. Spectra are each normalized to the strongest feature and displayed using 32 equally spaced contours. (Insets) Contouring in the carboxylate region further divides each original contour into six finer subcontours to highlight weak spectral features that are otherwise obscured. Regions where cross-peaks occur or are expected to occur are highlighted with red dashed boxes. The locations of the bidentate glutamate absorptions, present only in Ca2+−CaM, are marked with solid red arrows. The locations of observed cross-peaks are marked with solid black arrows. Some scatter is visible in the low-frequency region of the Lu3+−CaM spectra, but does not interfere with interpretation of the relevant spectral features.

