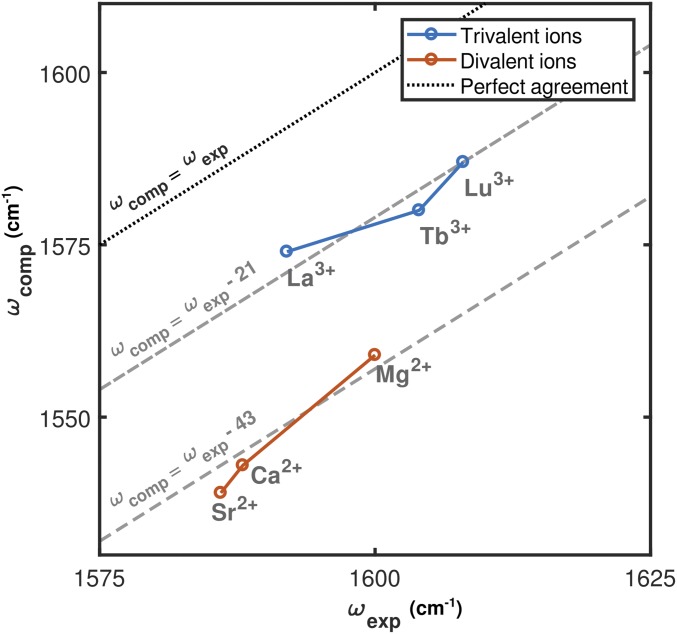
Fig. 7.
Comparison of computed EDTA asymmetric stretch frequencies with those measured spectroscopically. The computational frequency is calculated as the average of the three lowest vibrational modes. These modes have similar intensities and frequencies (Table S1). Experimental frequencies are extracted from Gaussian fits to the FTIR spectra. Computational results capture the spectroscopic shifts associated with both decreasing ionic radius and increasing ionic charge.

