
Figure 5. Collisions by month.
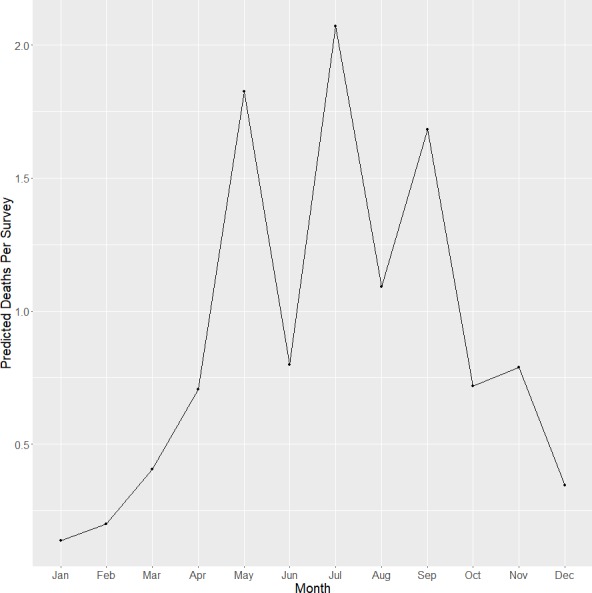
Mean number of collision deaths per survey for each month at the VTCRC (October 2013–May 2015). Months were combined across years.
Official websites use .gov
A
.gov website belongs to an official
government organization in the United States.
Secure .gov websites use HTTPS
A lock (
) or https:// means you've safely
connected to the .gov website. Share sensitive
information only on official, secure websites.
Mean number of collision deaths per survey for each month at the VTCRC (October 2013–May 2015). Months were combined across years.