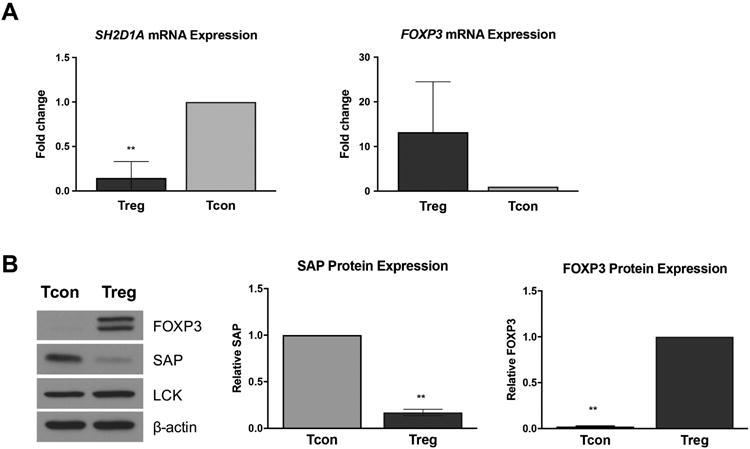
Figure 3. Inverse correlation between FOXP3 and SAP expression in human Tregs.

(A) RNA was extracted from activated cells, and qRT-PCR was performed with primers specific for FOXP3 and SAP mRNA. RPL30 was used as a housekeeping gene for normalization. Data are average ± SD of 3 independent experiments; significance was assessed by unpaired t tests. (B) Protein lysates were subjected to SDS-PAGE and Western blot analysis for FOXP3, SAP, and LCK. β-actin was used as a loading control. One representative blot is shown (left). Results from 3 independent experiments were quantified by spot densitometry (right) and assessed for significance by two-tailed t tests.
