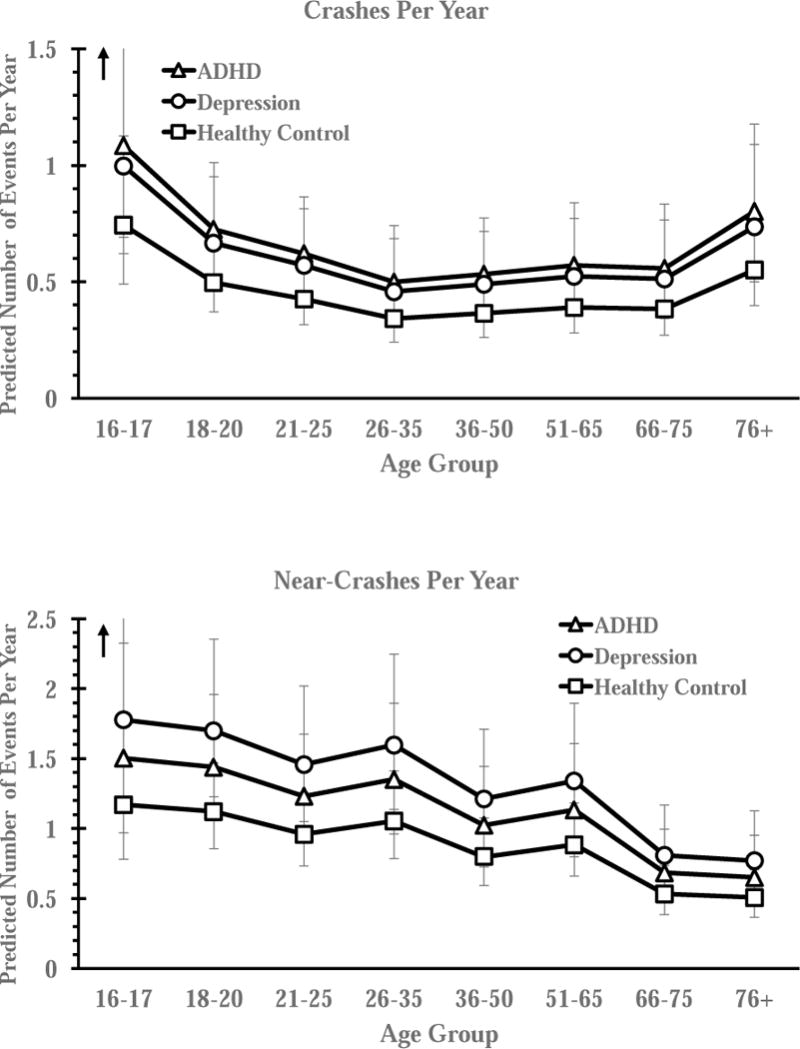
Figure 4.

Crash and near-crash risk as a function of clinical group and age group, controlled for age, gender, education, and marital status. Values reflect estimated marginal means for incidents per year, defined for days of continuous monitoring =365.25 and miles driven =15,000. Error bars reflect 95% Wald confidence intervals.
