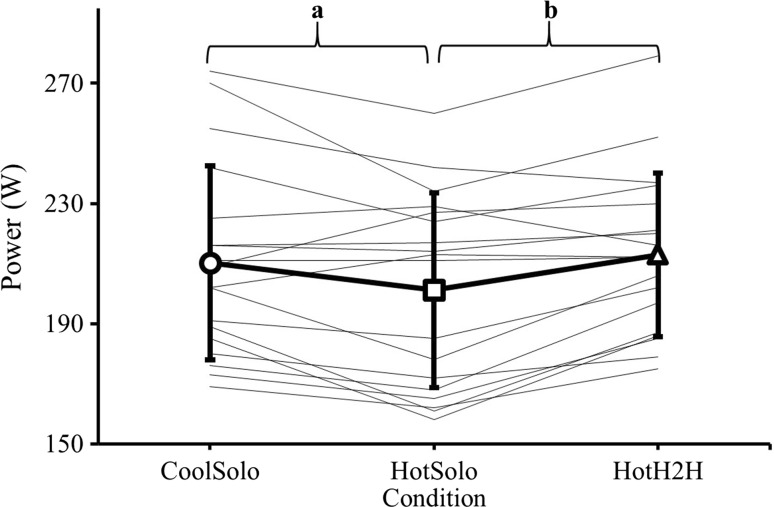
Fig. 1.
Mean (SD) [thick black line (n = 18)] and individual (thin black lines) average power outputs for 20-km time trials in cool (CoolSolo) and hot (HotSolo) environments, and a 20-km simulated head-to-head competition in a hot environment (HotH2H). a Significant difference (p < 0.05) between CoolSolo and HotSolo; b significant difference (p < 0.01) between HotSolo and HotH2H

