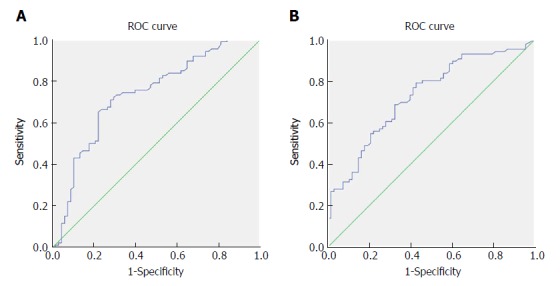
Figure 1.

Receiver operating characteristic curve analysis based on fibrinogen for overall survival. A: The area under the ROC curve (AUC) indicates the diagnostic power of preoperative plasma fibrinogen concentration. In this model, the optimum cut-off point for fibrinogen concentration was 3.47 g/L, AUC was 0.735 (95%CI: 0.654-0.816), with a sensitivity of 0.709 and a specificity of 0.721 by the Youden index. B: AUC indicates the diagnostic power of preoperative CA199 level. In this model, the optimum cut-off point for CA199 level was 25.45 U/mL, AUC was 0.729 (95%CI: 0.650-0.808), with a sensitivity of 0.791 and a specificity of 0.574 by the Youden index. AUC: Area under curve. ROC: Receiver operating characteristic curve.
