
Figure 3.
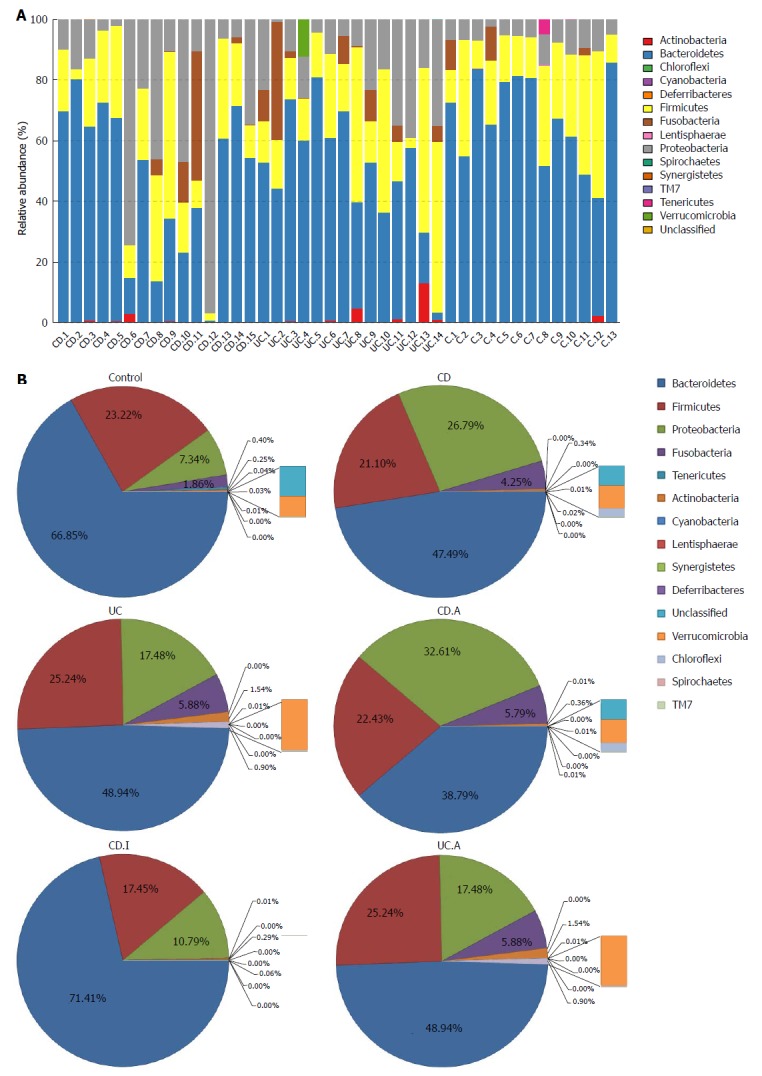
Taxonomic composition distribution in samples of phylum level. A: Individually; B: Integrally. CD: Crohn’s disease; CD.A: Active CD; CD.I: Inactive CD; UC: Ulcerative colitis; UC.A: Active UC.
Official websites use .gov
A
.gov website belongs to an official
government organization in the United States.
Secure .gov websites use HTTPS
A lock (
) or https:// means you've safely
connected to the .gov website. Share sensitive
information only on official, secure websites.
Taxonomic composition distribution in samples of phylum level. A: Individually; B: Integrally. CD: Crohn’s disease; CD.A: Active CD; CD.I: Inactive CD; UC: Ulcerative colitis; UC.A: Active UC.