
Figure 4.
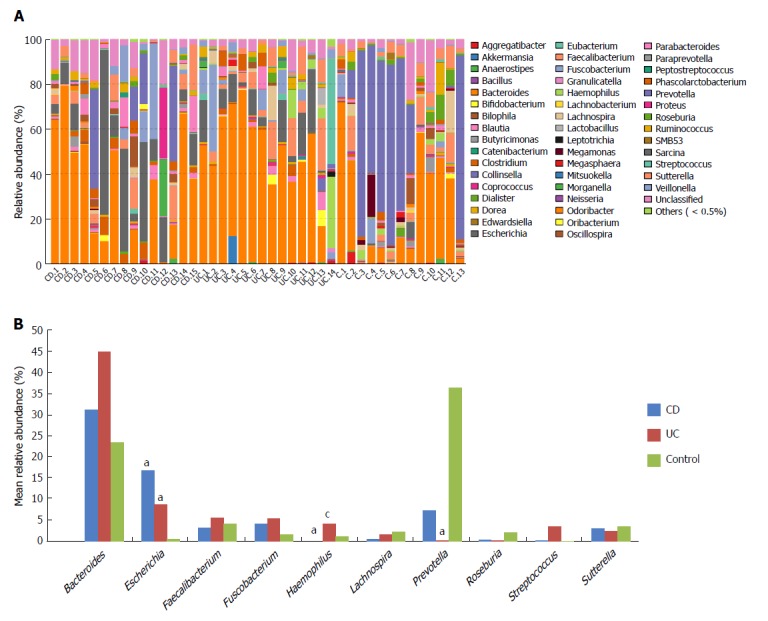
A: The taxonomic composition distribution in samples of genus level; B: Genera shown represent the 10 most abundant genera of CD, UC and control. aP < 0.05 vs control, cP < 0.05 vs CD. CD: Crohn’s disease; UC: Ulcerative colitis.
Official websites use .gov
A
.gov website belongs to an official
government organization in the United States.
Secure .gov websites use HTTPS
A lock (
) or https:// means you've safely
connected to the .gov website. Share sensitive
information only on official, secure websites.
A: The taxonomic composition distribution in samples of genus level; B: Genera shown represent the 10 most abundant genera of CD, UC and control. aP < 0.05 vs control, cP < 0.05 vs CD. CD: Crohn’s disease; UC: Ulcerative colitis.