
Fig. 2.
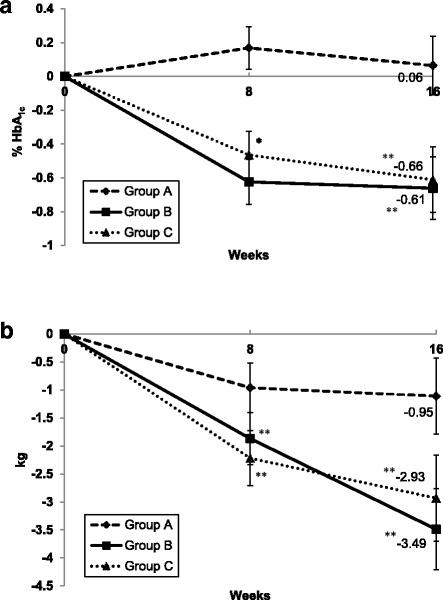
Change in HbA1c (a) and body weight (b) from baseline in response to different methods of nutrition therapy. Values are mean ± SEM. Group A: individualized nutrition therapy, Group B: Structured nutrition therapy, Group C: Structured nutrition therapy + weekly phone support. n = 36 in each group. * p < 0.01 and ** p < 0.001 compared to baseline