
Figure 2.
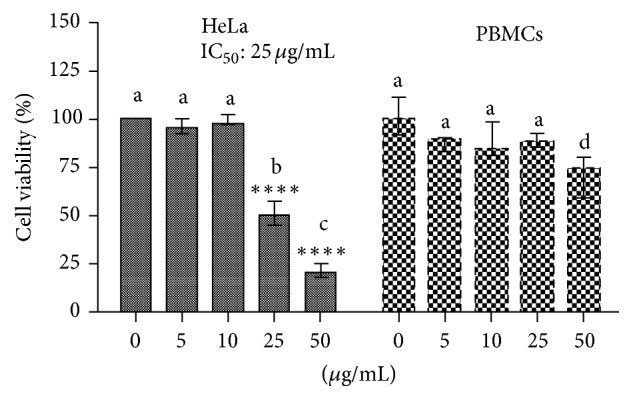
Viability analysis (MTT) of PBMCs and HeLa cell line exposed to the FR3 (0.5; 10; 25; and 50 μg/mL) for 72 hours. The results were expressed in relation to the DMSO control. ∗∗∗∗ indicates statistically significant differences between treatment and control in the same cell line. Different letters indicate statistically significant differences between each treatment between both cell lines (p < 0.0001).