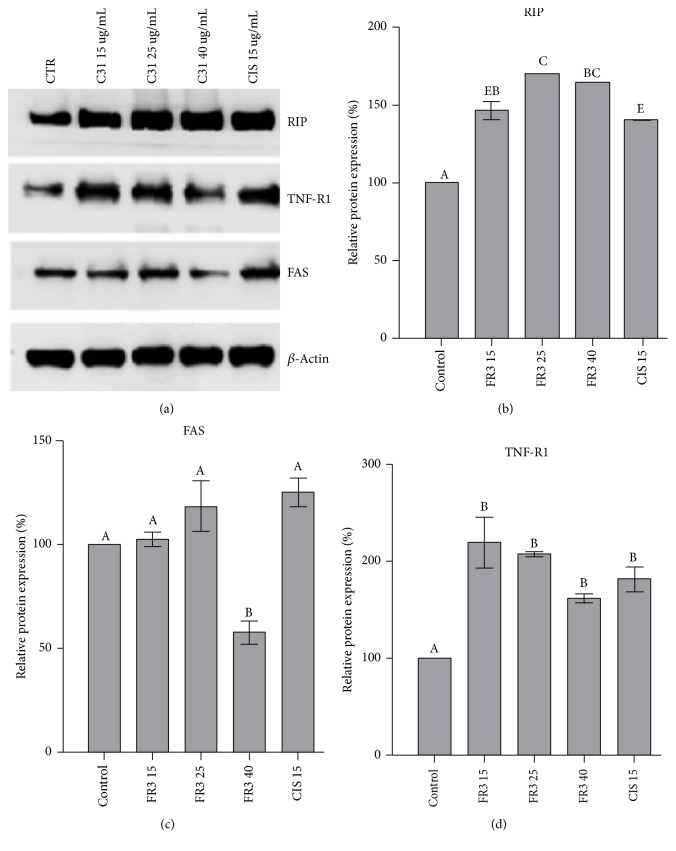
Figure 6.
Effect of the FR3 on RIP, FAS, and TNF-R1 in 24-hour treated HeLa cells at concentrations of 15 μg/mL, 25 μg/mL, and 40 μg/mL and Cisplatin at 15 μg/mL concentrations. (b)–(d) Densitometric analysis of the western blot transfer data of the three proteins. The significant difference with values of p < 0.0001. Different letters indicate statistically significant differences between each treatment with p ≤ 0.0001.

