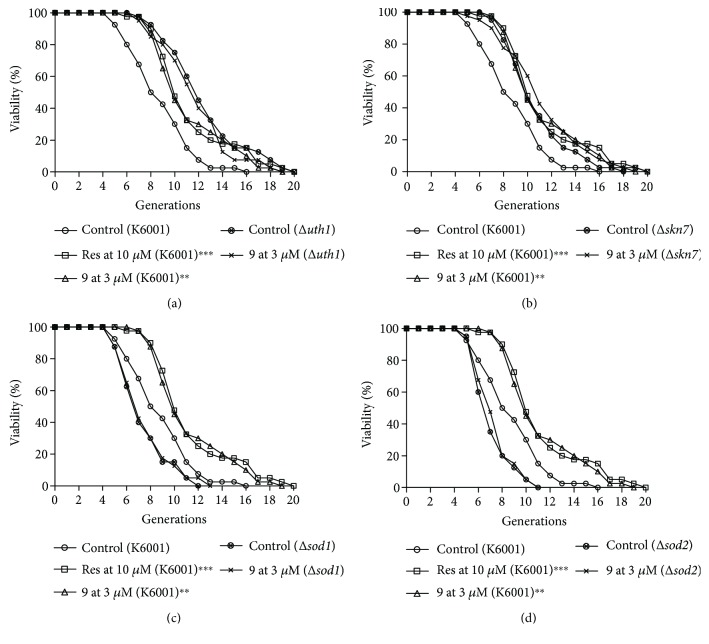
Figure 6.
Effect of compound 9 on the replicative lifespan of uth1 (a), skn7 (b), sod1 (c), and sod2 (d) mutants. The average lifespan of K6001 in the control group was 7.93 ± 0.41; Res at 10 μM, 10.45 ± 0.52∗∗∗; and compound 9 at 3 μM, 10.33 ± 0.49∗∗. (a) The average lifespan of Δuth1 in the control group was 11.60 ± 0.51 and compound 9 at 3 μM, 10.95 ± 0.46. (b) The average lifespan of Δskn7 in the control group was 9.88 ± 0.41 and compound 9 at 3 μM, 10.40 ± 0.53. (c) The average lifespan of Δsod1 in the control group was 6.55 ± 0.32 and compound 9 at 3 μM, 6.65 ± 0.34. (d) The average lifespan of Δsod2 in the control group was 6.28 ± 0.25 and compound 9 at 3 μM, 6.50 ± 0.25 (∗∗P < 0.01 and ∗∗∗P < 0.001).

