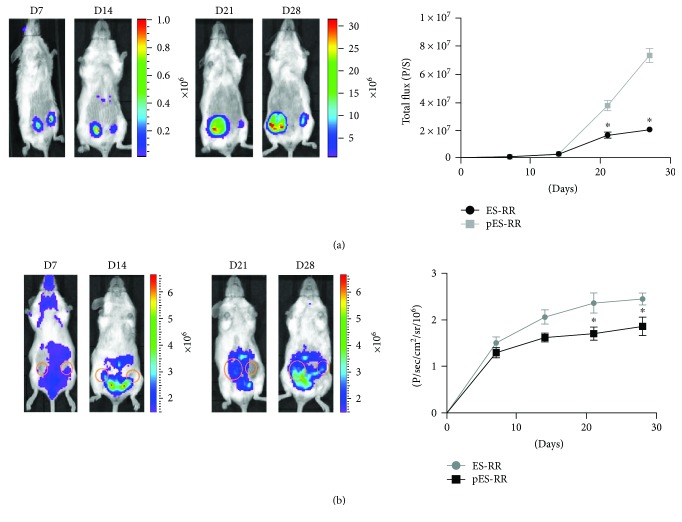
Figure 3.
Visualization of the teratoma growth and VEGFR2 expression in vivo. (a) Rluc imaging of teratoma progression of Rluc signals showed that the teratoma formed in pES-RR group was smaller than that in ES-RR group. Quantification analysis demonstrated there was a significant difference between the two groups. (b) Fluc imaging and quantification analysis of VEGFR2 expression in transgenic mice revealed enhanced angiogenesis in ES cell-derived teratomas. ∗P < 0.05 compared with the ES-RR group.

