Figure 4.
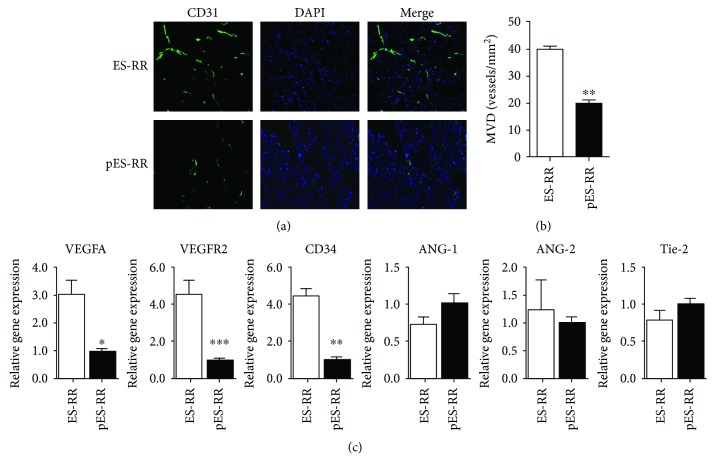
Analysis of teratoma angiogenesis. (a) Angiogenesis observed in pES-RR group and ES-RR group by CD31 immunofluorescence staining. (b) Microvessel density (MVD) of teratoma tissue was measured by computer image analyzing system. (c) The expression of CD34/VEGF/VEGFR2 was significantly lower in pES-RR group compared with ES-RR group, whereas there was no significant difference in the expression of ANG-1/ANG-2/Tie-2 between these two groups. ∗P < 0.05; ∗∗P < 0.01; ∗∗∗P < 0.001.

