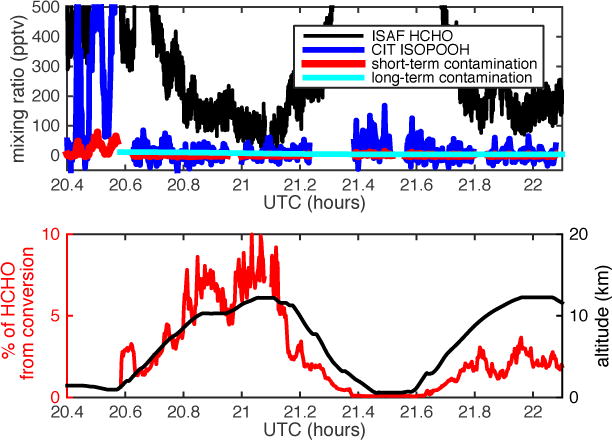
Figure 6.

Hypothesized HCHO signal from delayed ISOPOOH conversion, shown for part of SEAC4RS flight on 6 September 2013. Top panel: Time series of ISAF HCHO (black line), CIT ISOPOOH (blue line), potential HCHO signal from prompt ISOPOOH conversion (red line), and potential HCHO signal from delayed ISOPOOH conversion (cyan line). Bottom panel: Altitude (black line) and percentage of HCHO that might be from delayed ISOPOOH conversion (red line).
