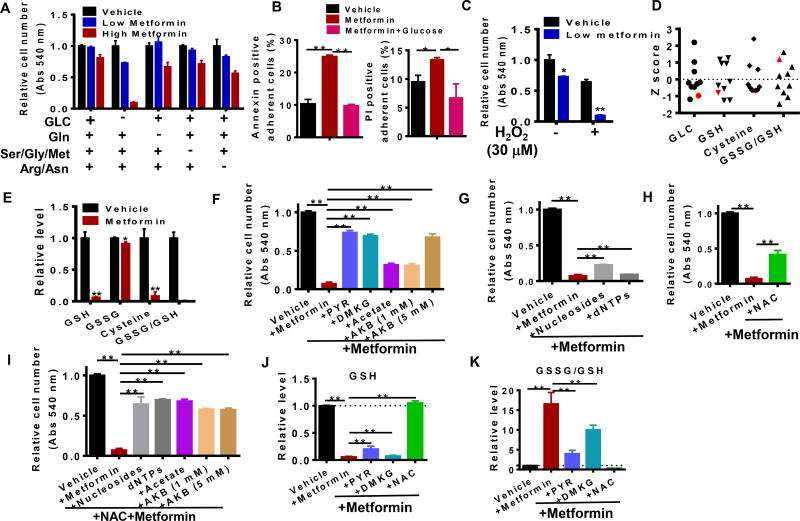
Figure 6. Metformin response and resistance depends on the availability of specific nutrients.
A. Response to metformin treatment in different medium conditions. Abs: Absorbance (at 540 nm from MTT assay). GLC: Glucose (11 mM), Gln: Glutamine, Ser/Gly/Met: Serine, glycine and methionine, Arg/Asn: Arginine and Asparagine. Low metformin: 0.5 mM metformin, High metformin: 1.5 mM metformin. B. Metformin effect on cell proliferation in the presence of low glucose (1mM) and/or hydrogen peroxide (H2O2, 30 µM). C. Annexin and PI positive populations of adherent cells after 40 hours of metformin treatment. D. Z score distribution of glucose (GLC) and redox metabolites (GSH, cysteine and GSSG/GSH) in patients after metformin treatment. The long term survivor is highlighted in red color. E. Relative levels of redox metabolites in ovarian cancer cells with or without metformin treatment for 24 hrs. F. Cell viability in the presence of metformin and precursors of the TCA cycle (PYR: pyruvate; DMKG: dimethyl α-ketoglutarate; Acetate: sodium acetate; AKB: α-ketobutyrate). G. Rescue of metformin-induced loss of cell viability by nucleosides or deoxynucleotide triphosphates (dNTPs). H to I. Cell viability in various medium with or without N-acetylcysteine (NAC). J to K. Redox status in different treatment conditions. * p<0.05, ** p<0.01 Error bars obtained from SEM of n=3 independent measurements.

