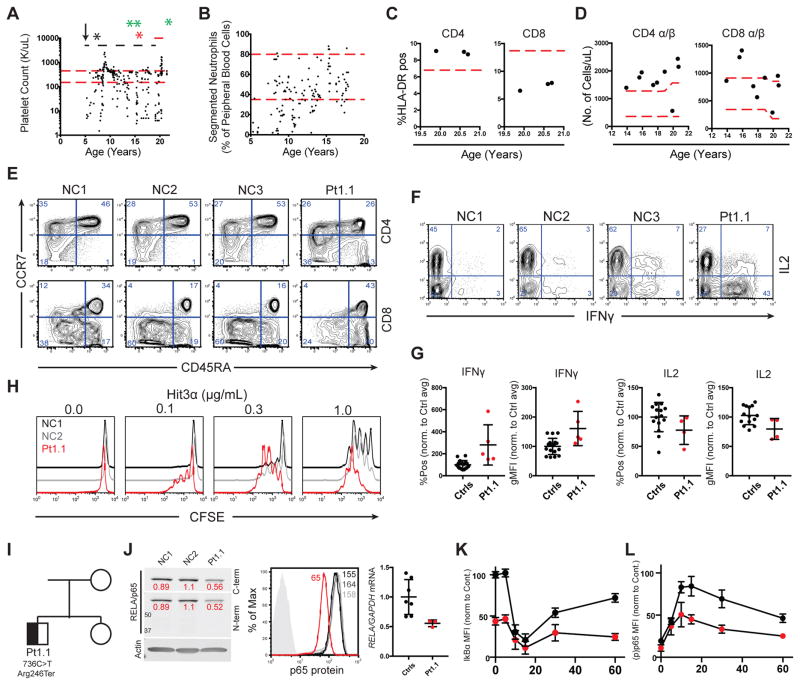
Figure 1.
RELA haploinsufficiency leads to a T cell mediated autoimmune lymphoproliferative disease
Patient platelet and neutrophil counts (red dashed lines, arrow, black, green, and red asterisks represent the normal range, age of onset, splenectomy, rituximab administration, and systemic immune response to pneumococcal vaccine, respectively. Black dashed and solid red lines represent MMF and eltrombopag administration, respectively (A/B). CD4+ and CD8+ cells expressing HLA-DR, red line indicates high end of normal range (C). CD4+ and CD8+ α/β T cells/uL of patient blood, red lines indicate normal range (D). CCR7 and CD45RA expression on CD3/CD4+/+ lymphocytes (E). Representative IFNγ and IL2 production in phorbol 12-myristate 13-acetate and ionomycin (PMA/I) restimulated CD4+ T cells (F). IFNγ and IL2 production in cells stimulated as in F, pooled from 4 separate experiments (G). Proliferation of CD4+ blasts following re-stimulation with 1 μg/mL anti-CD28 and the indicated dose of anti-CD3 (n=3) (H). Family pedigree and de-novo RELA variant (I). Protein expression in CD4+ T cell blasts by western blot (RELA/Actin ratios in red) (left), flow cytometry (center), and RELA mRNA levels determined by qRT-PCR (right) (J). IkBα degradation and p65 phosphorylation following PMA/I stimulation, pooled from 3 separate experiments (K and L, respectively).

