
Figure 4.
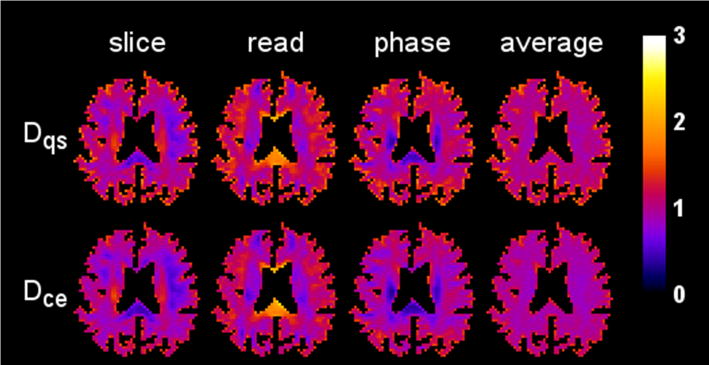
Diffusivity maps from a single axial brain slice for three different diffusion encoding directions (slice, read, phase) together with their arithmetic means (average). The first row shows the maps obtained with the QS approximation, while the second row shows those for the CE approximation. The scale bar is in units of μm2/ms.