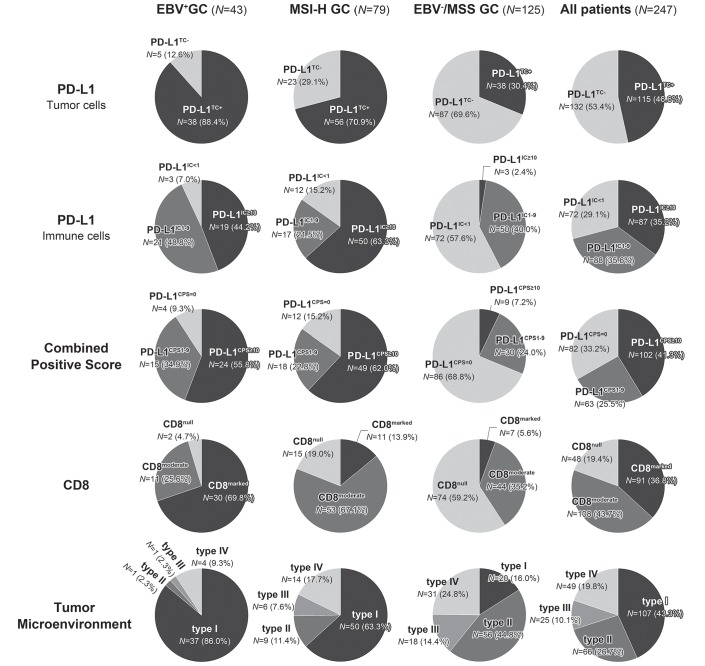
Figure 2.
Pie charts of PD-L1 and CD8 immunohistochemistry. The proportions of PD-L1TC+, PD-L1CPS≥1, CD8marked and TME type I were most frequently observed in EBV+ GC, while the proportion of PD-L1IC≥10 was the highest in MSI GC. GC, gastric cancer; PD-L1, programmed death-ligand 1; TME, tumour microenvironments.

