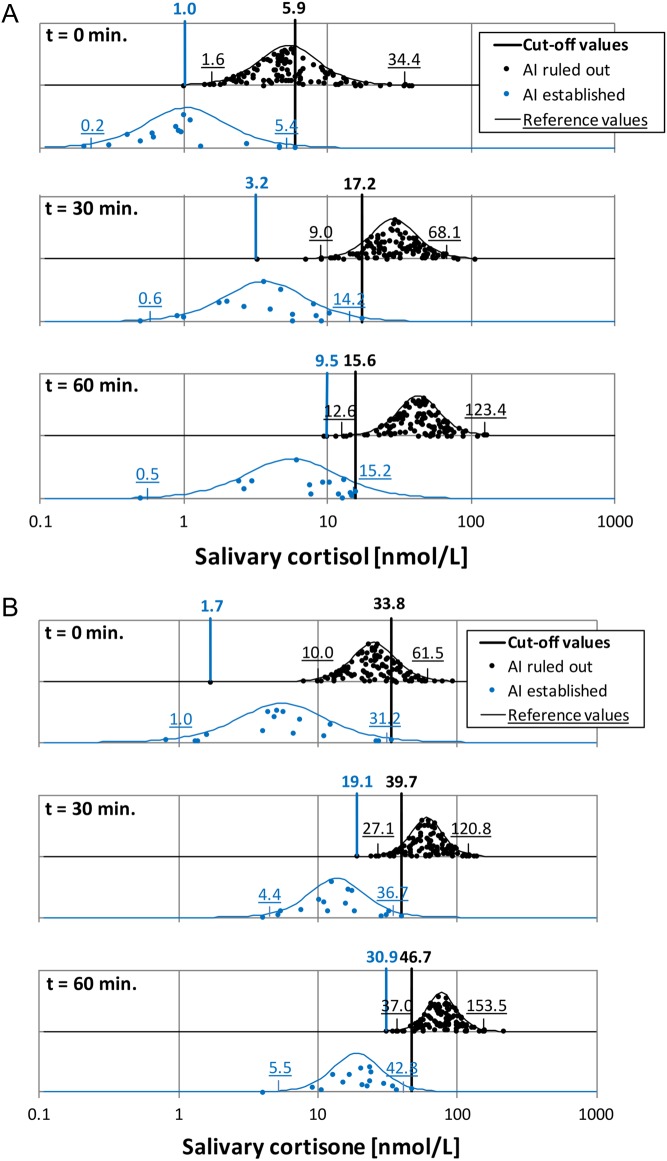
Figure 1.
Salivary cortisol (A) and cortisone (B) concentrations during ACTH stimulation tests. Results are given for patients in whom AI was ruled out (black dots) or established (blue dots). Concentrations are shown on a logarithmic scale (X-axis), accompanied by fitted normal distributions (black and blue lines) on an arbitrary Y-axis. Cut-off values (black and blue vertical lines, numbers in boldface) and reference values (underlined numbers in black and blue) are shown.

 This work is licensed under a