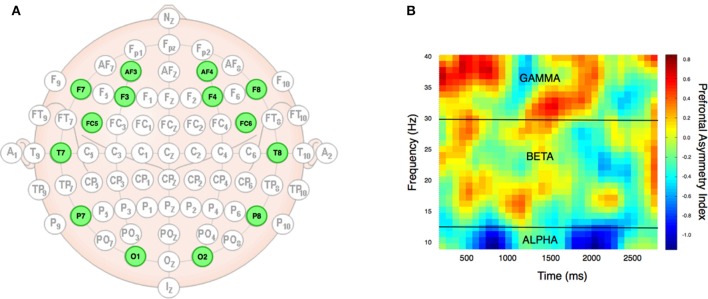
Figure 2.
EEG setup and data types. The electrodes were positioned bilaterally according to the 10/20 system (A) at 14 specific locations (highlighted in green). From the raw EEG data, Fourier transformation provided alpha, beta, and gamma frequency bands, which allowed analysis of prefrontal asymmetry over time in these three different frequency domains, as exemplified by data from a single subject (B). The (B) plot was achieved by running the PAI analysis on the frequency bands from 10 to 40 with an increment of 1 Hz (y-axis), and over time with a range from 100 to 3,000 ms with increments of 100 ms (x-axis). The heat map indexes the prefrontal asymmetry normalized as z-scores. Yellow to red colors denote positive PAI score, while cyan to blue colors denote low PAI scores. Black lines indicate frequency band borders of alpha, beta, and gamma.

