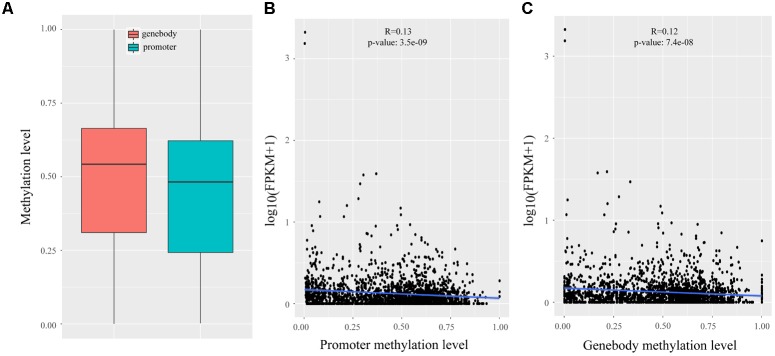
FIGURE 4.
Methylation analysis of lincRNAs. (A) Comparison of methylation level between the promoter and genebody of lincRNAs; (B) Scatter plot of the methylation level of lincRNA promoter and lincRNA expression; (C) Scatter plot of the methylation level of lincRNA genebody and lincRNA expression. The Pearson correlation coefficient was calculated between the log2 ratios of lincRNA expression and lincRNA methylation. The line represented regression line. The statistical significance was calculated by R language (version: 3.3.3).

