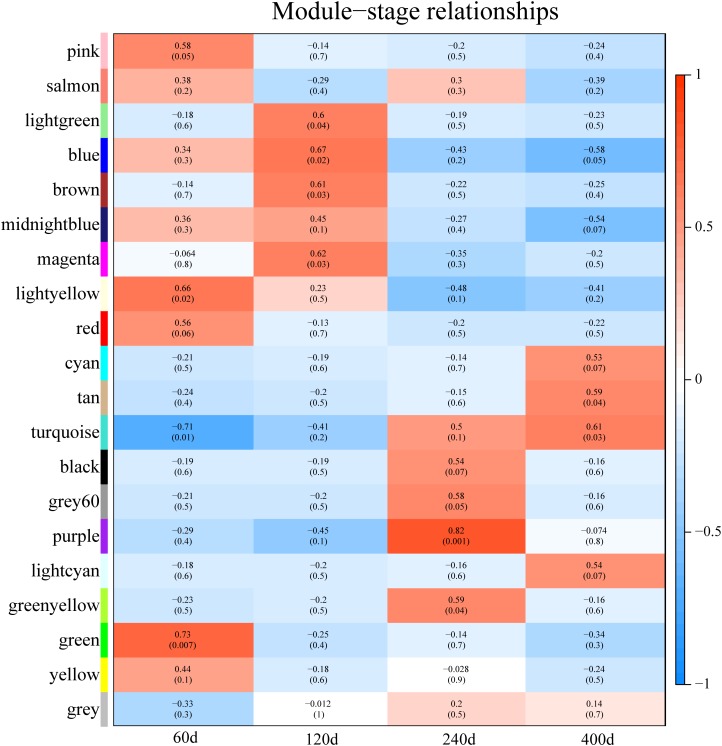
FIGURE 6.
Module-stage correlations and corresponding p-values. On the left, different colors represent different modules. Each cell contains the correlation and p-value given in parentheses. Cells are color-codes by the correlation according to the color legend on the right. Red, positive correlation; white, none correlation; blue, negative correlation. “60d” represents 60 days, similar as “120d,” “240d,” and “400d.”

