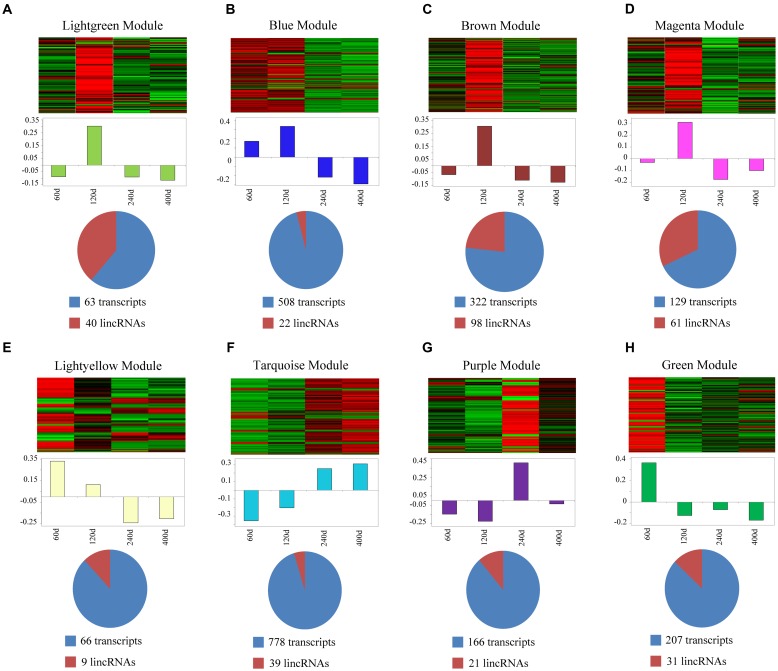
FIGURE 8.
Co-expression networks of lincRNAs and protein-coding genes in different modules. (A–H) Top of each panel: heat maps of expression level for eight modules of co-expressed genes in four stages. Red, increased expression; black, neutral expression; green, decreased expression. Middle of each panel: bar plots of the values of corresponding module eigengenes. Bottom of each panel: pie charts showing the abundance of lincRNAs within each module. “60d” represents 60 days, similar as “120d,” “240d,” and “400d.”

