FIGURE 9.
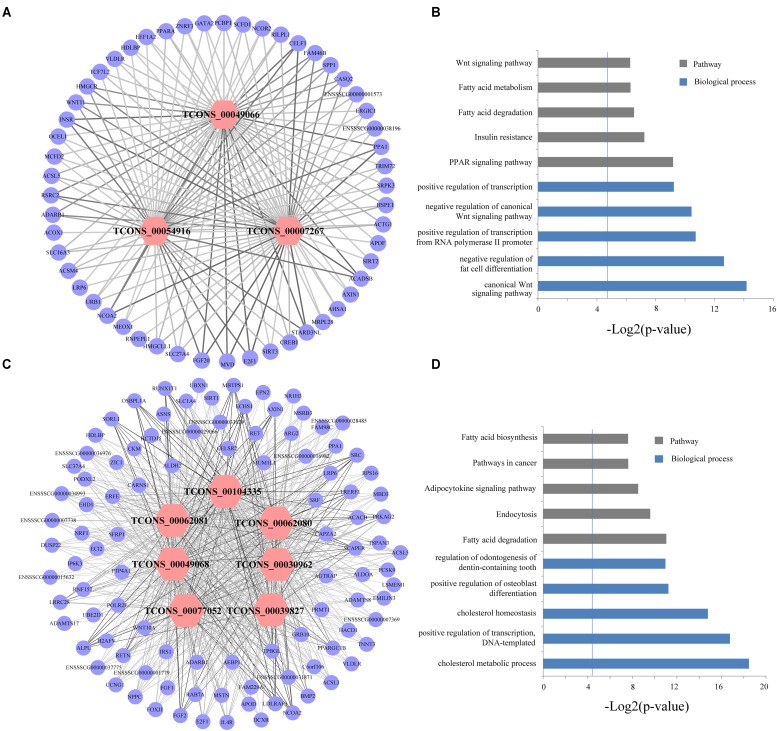
(A,C) Network visualization of the co-expression of hub lincRNAs and protein-coding genes in lightgreen and magenta module, respectively. Outer circles indicate protein-coding genes; inner hexagons indicate hub lincRNAs. The line thickness represents the correlation between lincRNAs and protein-coding genes. (B,D) Gene ontology and pathway analysis of protein-coding genes co-expressed with hub lincRNAs in lightgreen and magenta module, respectively. The vertical line represents the threshold of significance (-log2(0.05)≈4.3).

