Figure 5.
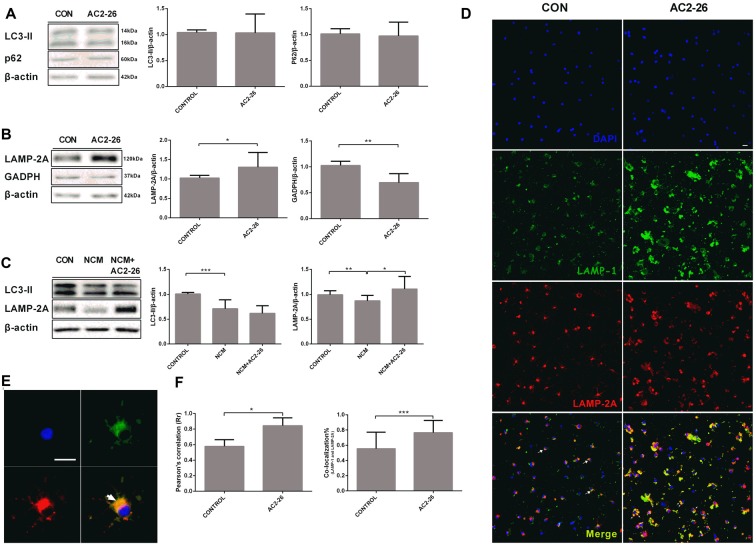
Chaperone-mediated autophagy (CMA) is activated in microglia exposed to Ac2-26. (A) Representative immunoblots ofLC3-II and P62 in microglia treated with Ac2-26 (10 μM; left); quantitative analysis of the levels of LC3-II and P62 (right). (B) Representative immunoblots of LAMP-2A and GADPH in microglia treated with Ac2-26 (10 μM; left); quantitative analysis of the levels of LAMP-2A and GADPH (right). (C) Representative immunoblots of LC3-II and LAMP-2A in microglia treated with Ac2-26 (10 μM) in the presence of NCM as indicated (left); quantitative analysis of the levels of LC3-II and LAMP-2A (right). The amount of each protein was normalized against that of β-actin. (D,E) Immunofluorescence for LAMP-1 and LAMP-2A in rat microglia treated with or without Ac2-26 (10 μM). The scale bar represents 20 μm. (F) Colocalization staining area with respect to the total cellular area (left). Pearson’s coefficient (r) indicates the correlation of the intensity values of the red and green pixels in the dual-channel images (right). The arrowheads indicate colocalization. The data are representative of at least three independent experiments and shown as the mean ± SEM. *P < 0.05; **P < 0.01; ***P < 0.001 vs. control.

